Learned is a performance management platform. Every employee has a job profile with the behaviours their role asks for. In each evaluation, the manager scores those behaviours, and together they make up the employee's total performance score.
This project started with one question: how can we help employees grow in their career? Behind it sat a bigger ambition. Learned should become more action-oriented. Not a tool you open once a year for your evaluation, but a place where you work on your progress in between, and keep it visible.
The problem
Learned didn't show what your next career step could be, or how to get there. Employees couldn't see where they fell short, or how they were working on it. Managers couldn't see who could grow where.
For the business, this was a gap. Users expected a performance platform to help them grow. Filling it would make Learned more complete and easier to sell. And a platform people work in more often keeps customers with us.
My approach
1. Starting with a comparison
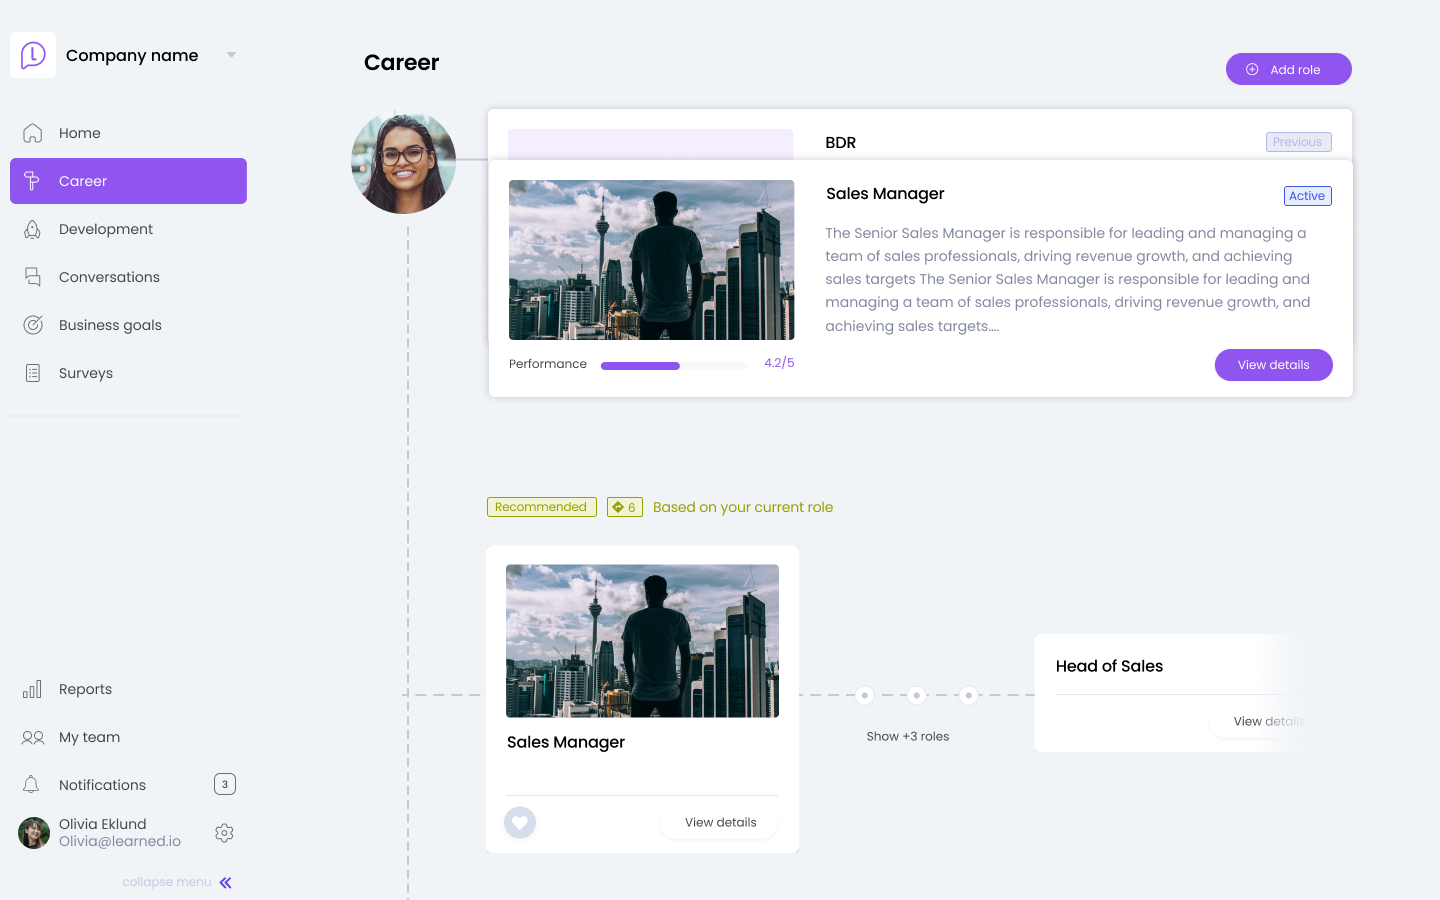
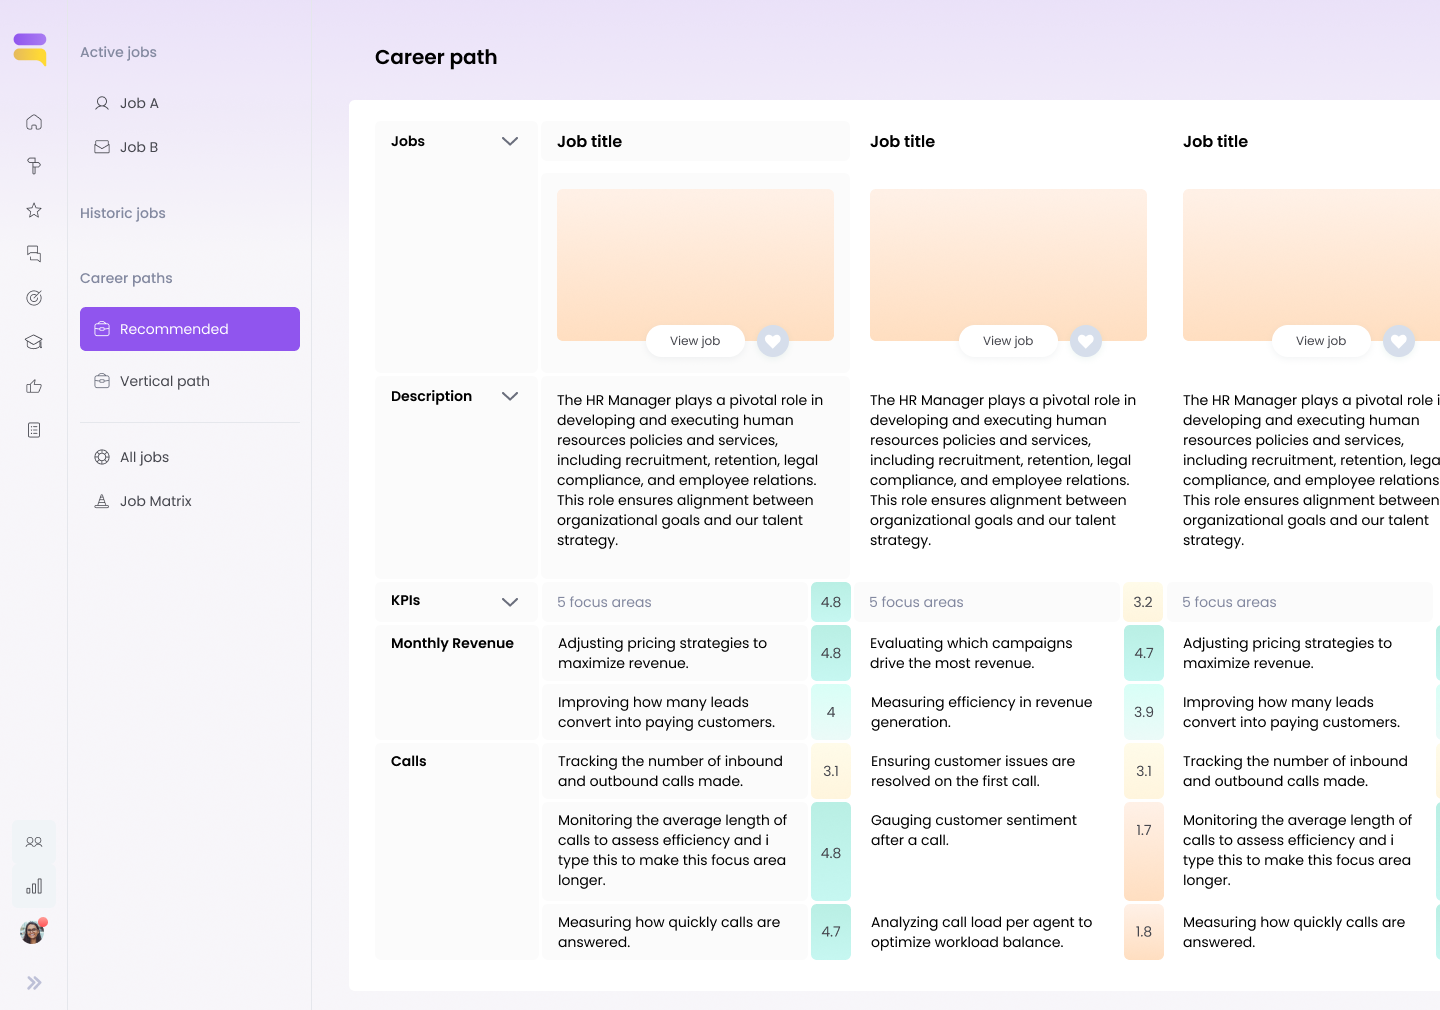
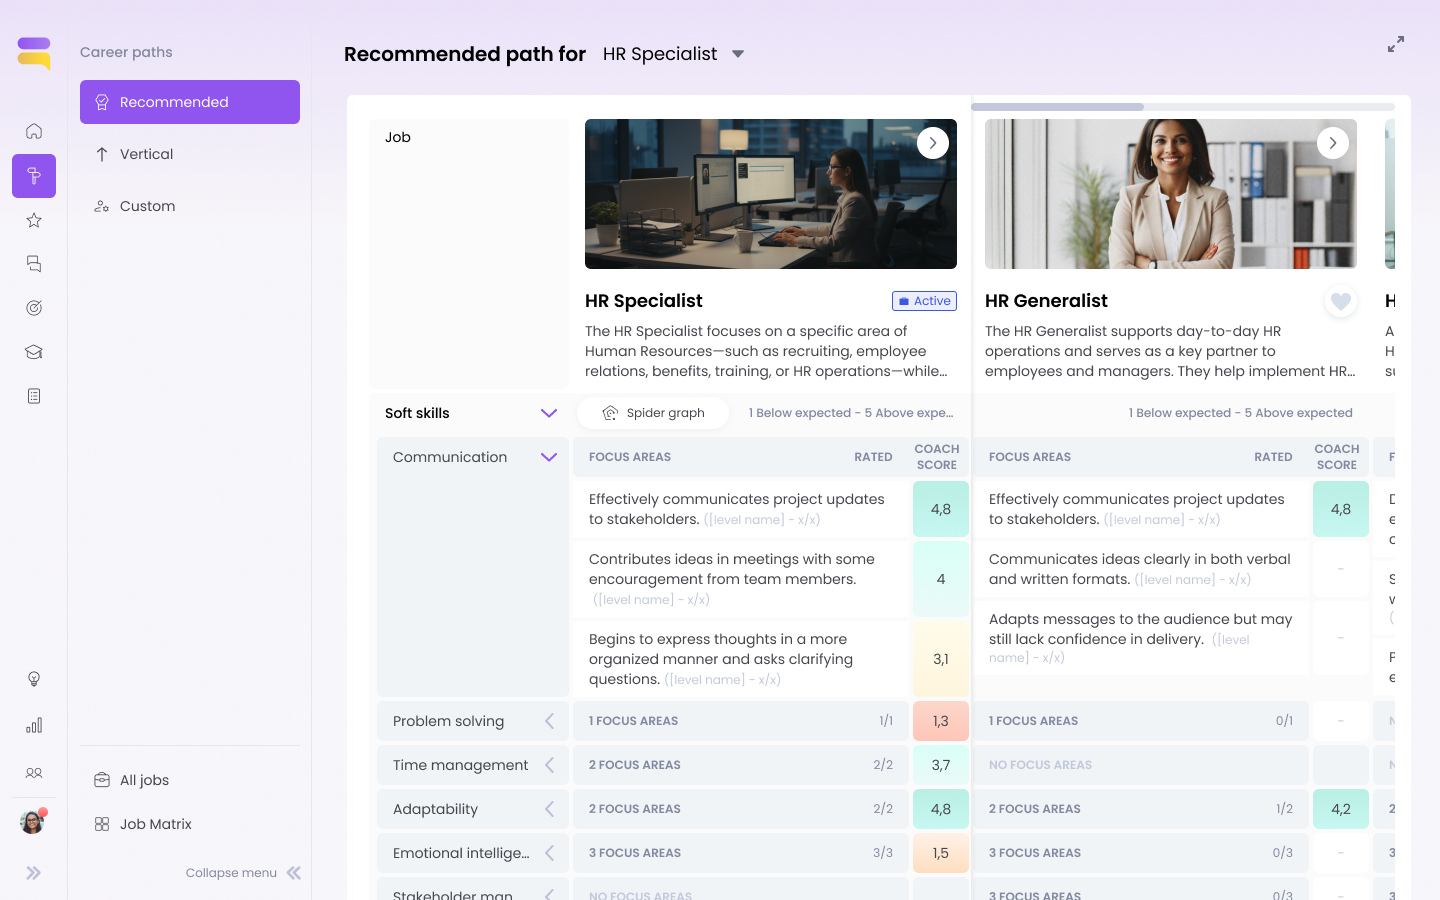
Learned's career page let employees view possible career paths, but it showed nothing about the jobs themselves. You couldn't tell how two jobs differed. To redesign it, I sketched many ways to make that visible. It became a comparison table, with one big addition: your performance score right next to each behaviour. It got very positive reactions, and would come back later.
The old career pageFirst comparisonYour score next to each behaviour
2. From comparing to planning
The comparison helped, but once you know where you want to grow, how do you get there? Career plans are a common way of coaching in HR, so I took on conceptualising them: a plan for an ambition, for growing within your job, or for improvement.
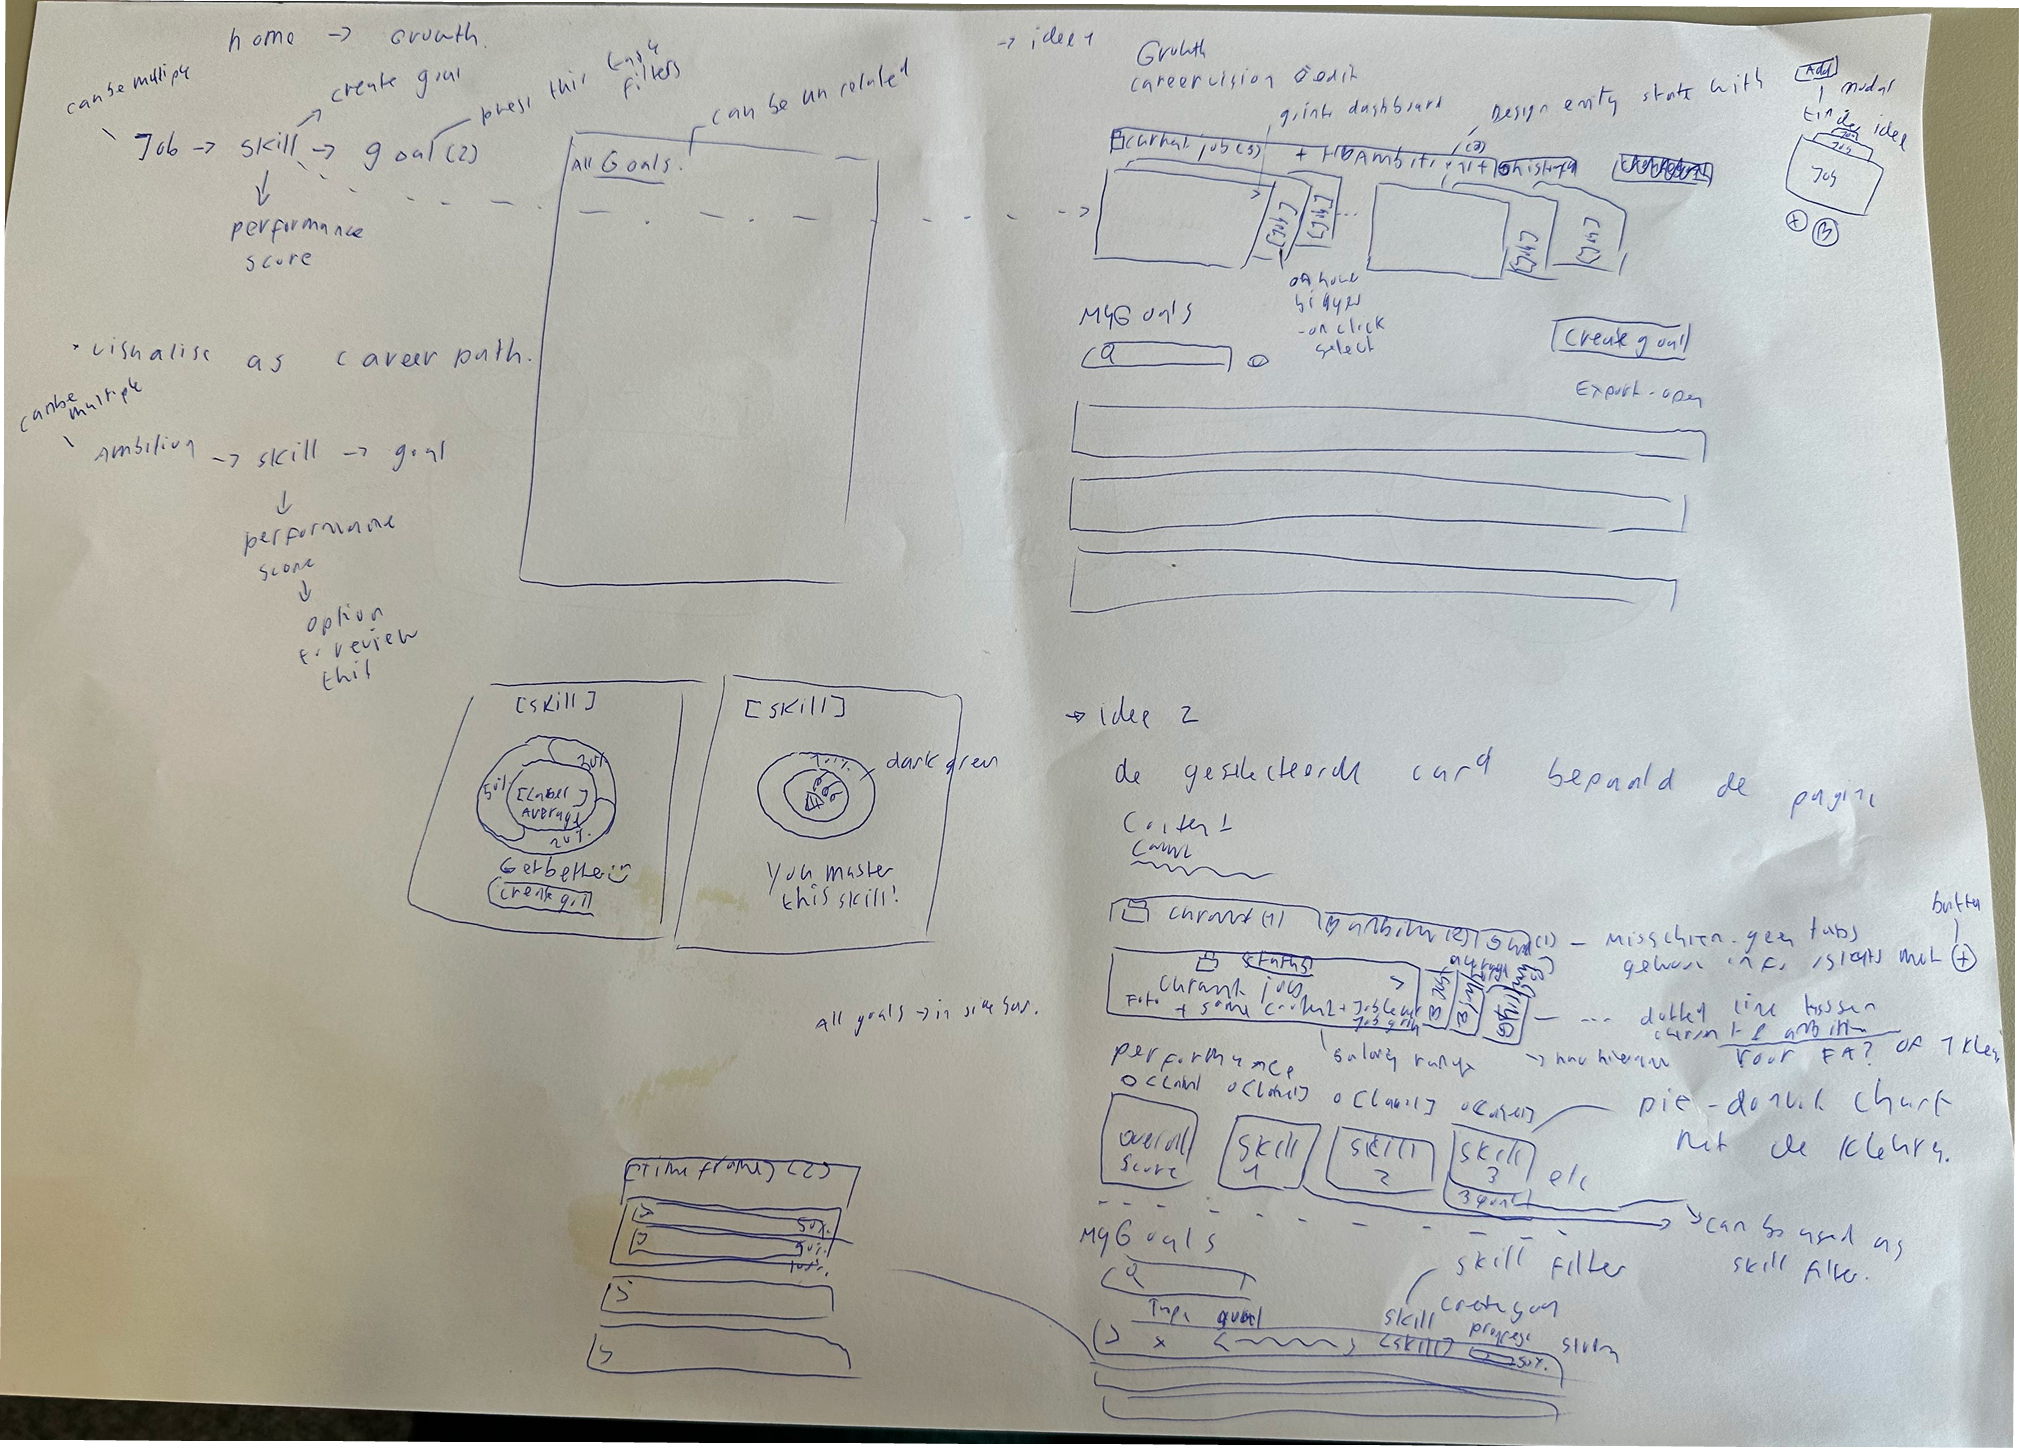
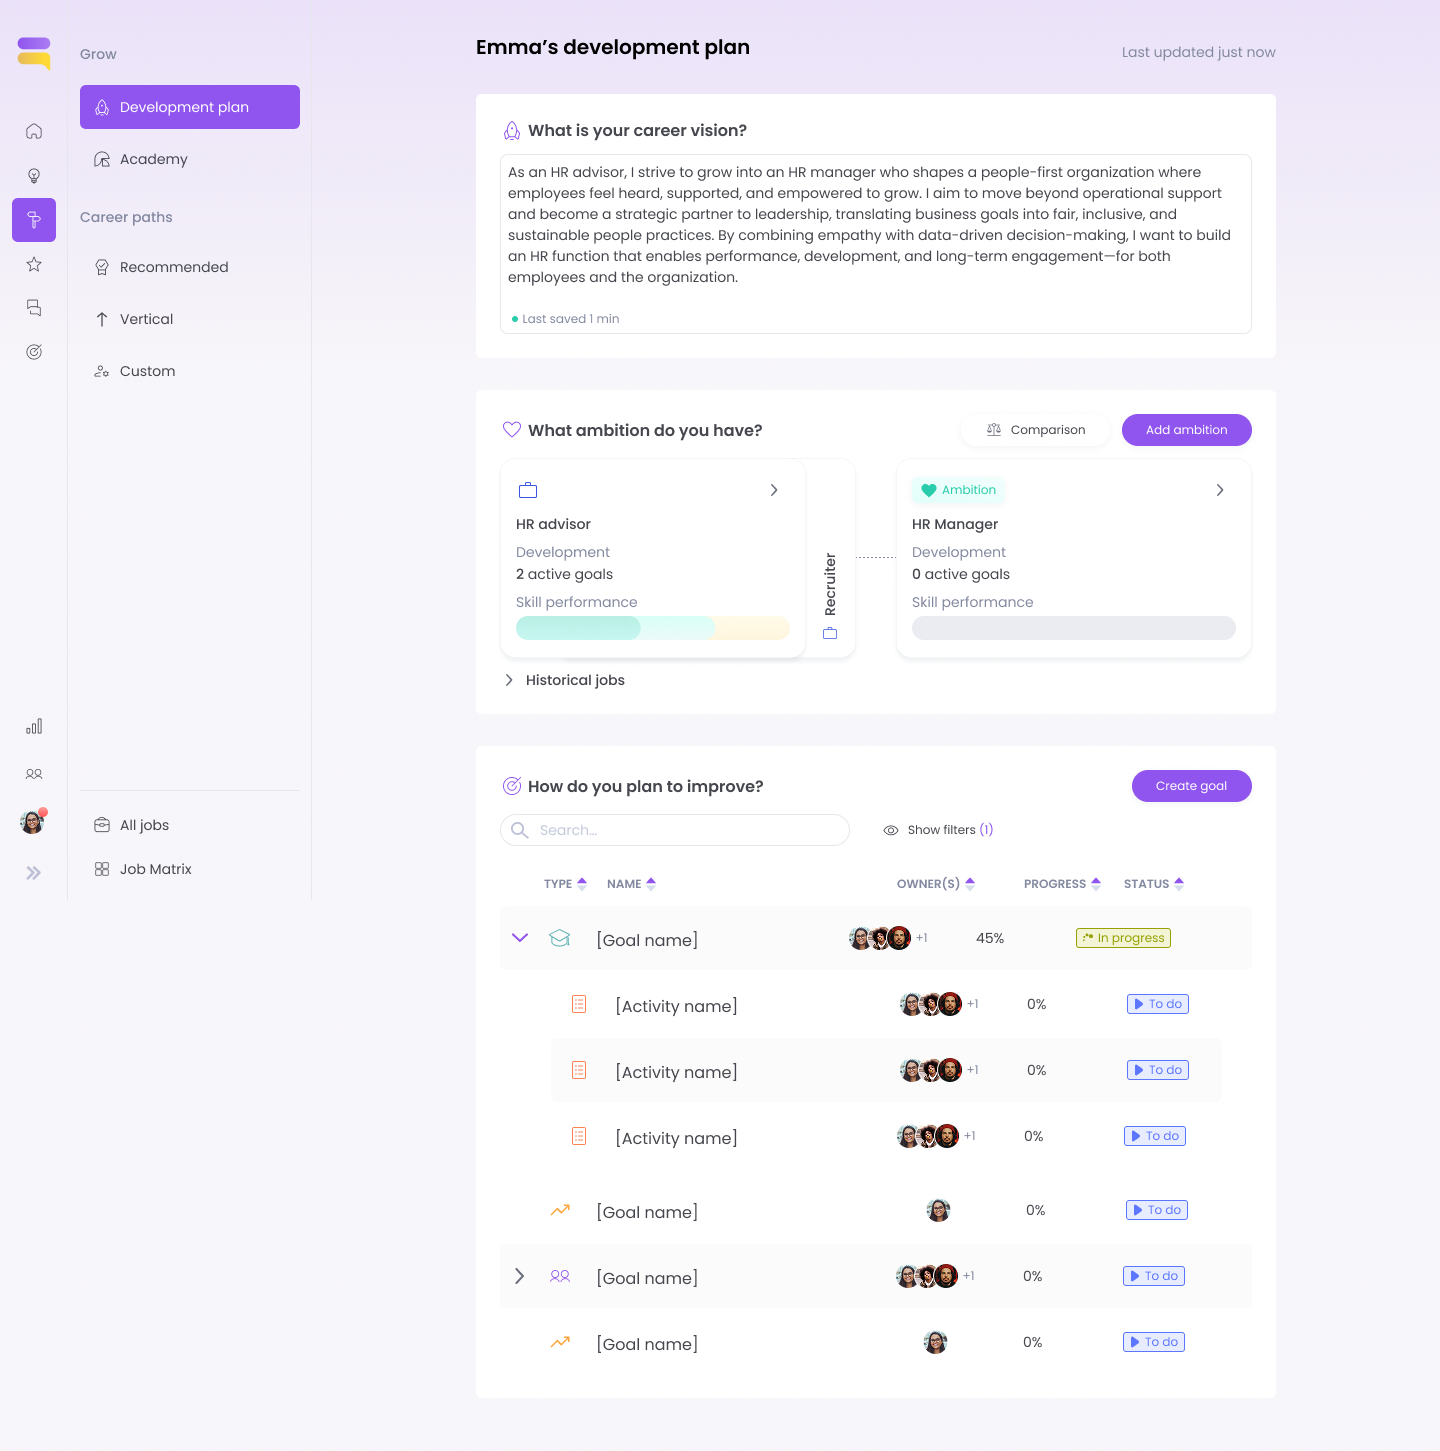
I mapped the flows, sketched, made design variations and gathered feedback from stakeholders and users. My first concept stacked the job, its total score, your ambition and your goals on one page. It looked good, but it didn't feel like the most integrated way to offer this. It duplicated functionality and raised questions like: where do I manage my goals now?
Sketching the planThe plan as a form
3. Letting go of the form
Feedback on that concept came from three sides:
The Head of Product, building on problems CS and Sales knew well: goals should be what makes growth actionable. This plan didn't invite that, because goals weren't linked to the skills you're scored on. His suggestion: merge the goals module into the career module.
Users: setting up a plan felt like too big a step, so people wouldn't do it.
Managers: in a 1:1, they go through the behaviours and scores, give feedback through insights and discuss progress through goals.
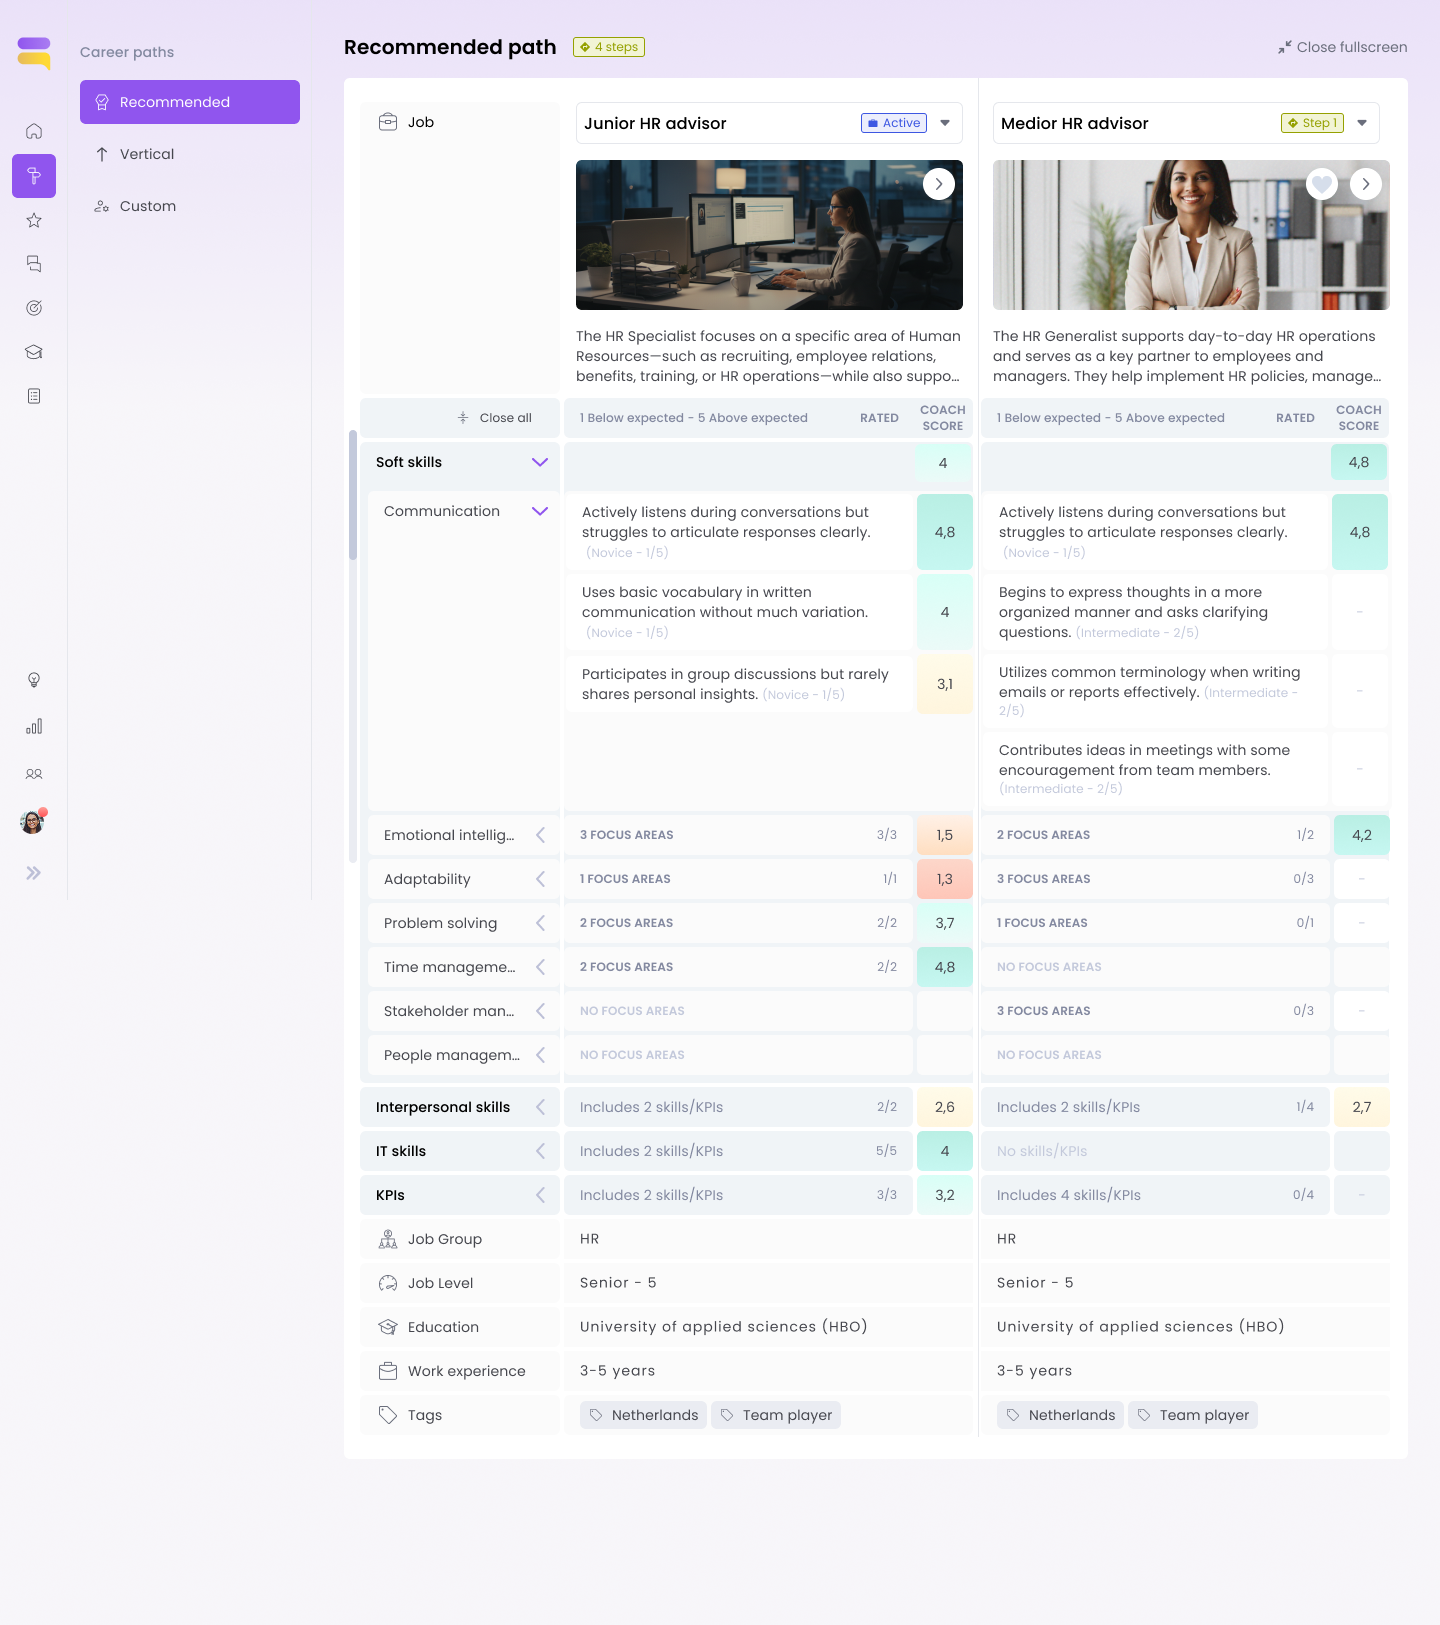
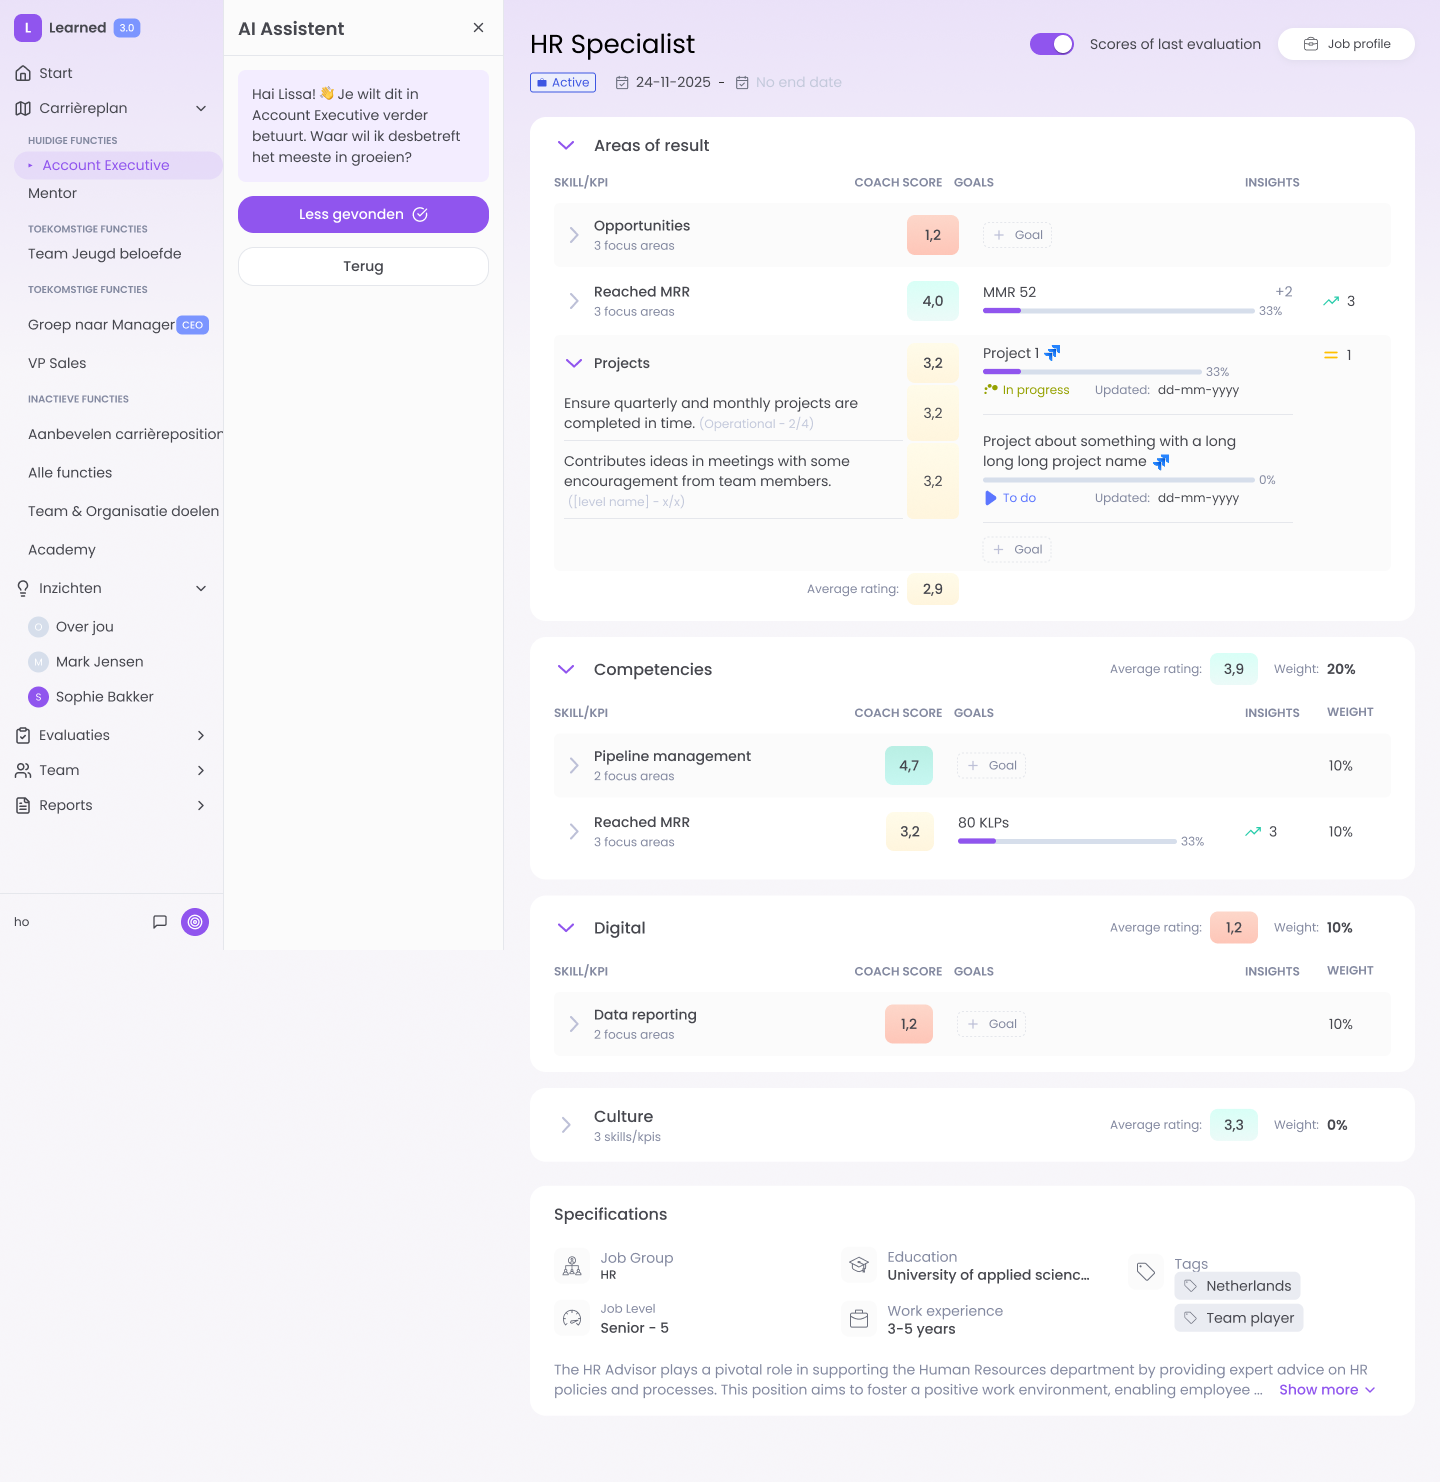
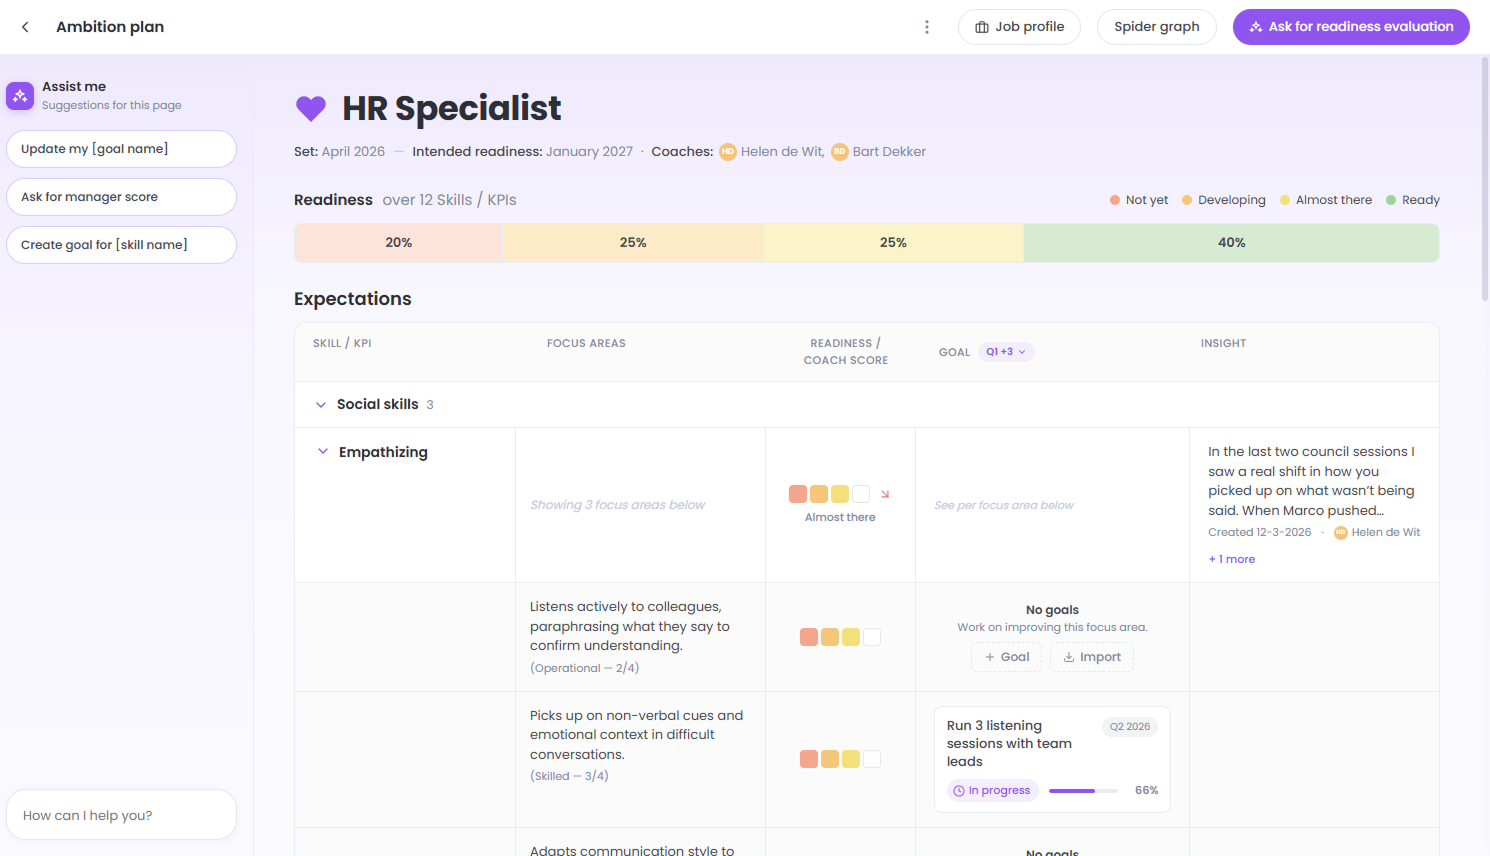
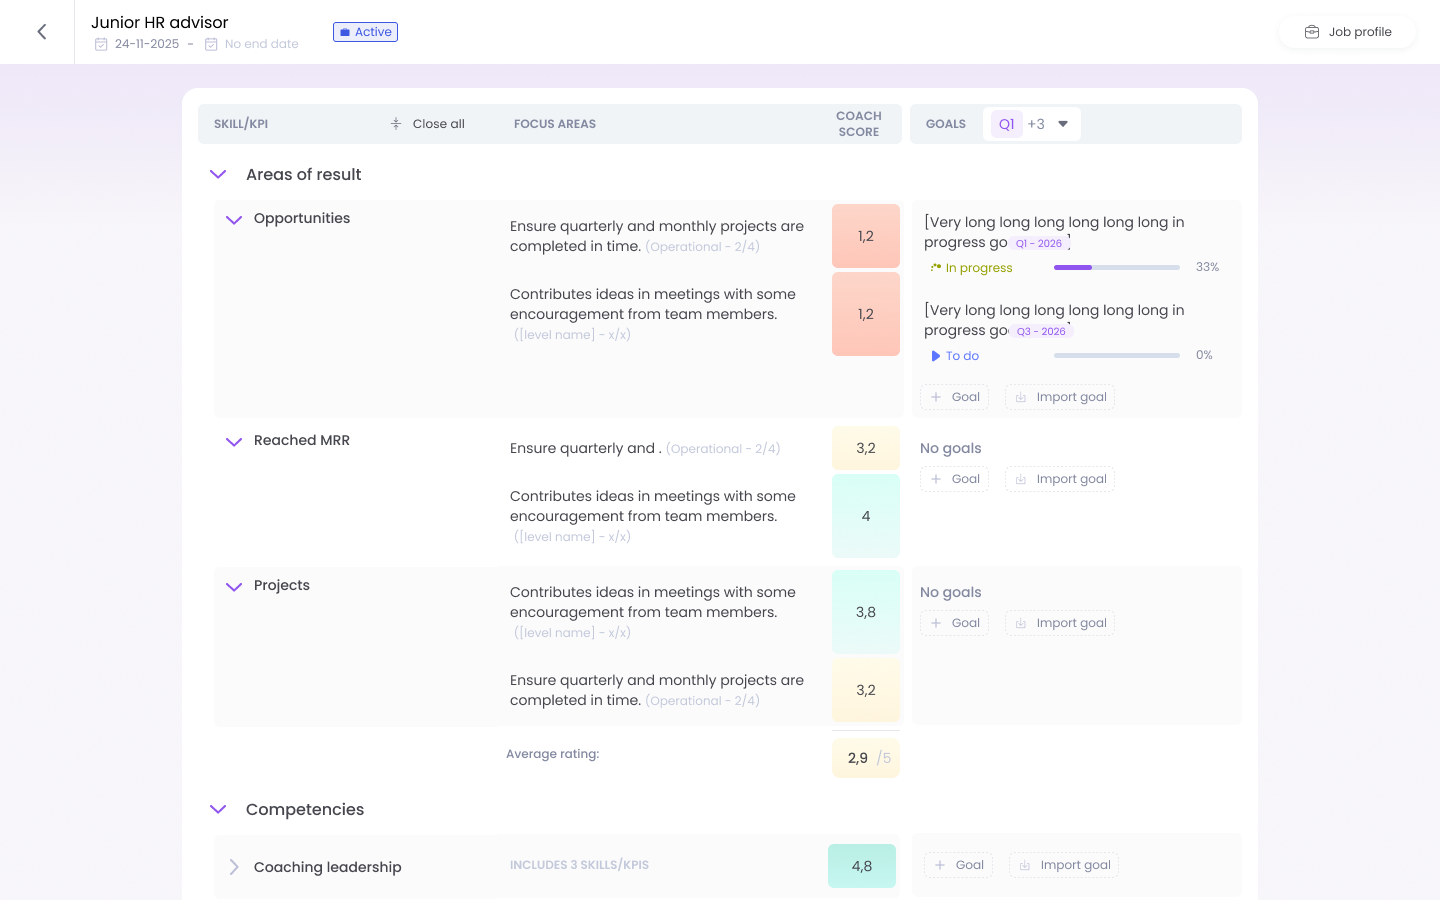
Together, this made me let go of my first idea. In HR, a development plan is usually a form. Focusing on the problem instead, I found a much simpler idea: show the job profile as a table. Each behaviour with its score, the goals that work on it, and the insights about it.
Nobody has to set anything up: the table runs on data Learned already has. And it built on the comparison table people already liked.
The job profile as a tableAmbition plan with readinessWorking out the table
4. Making the table work
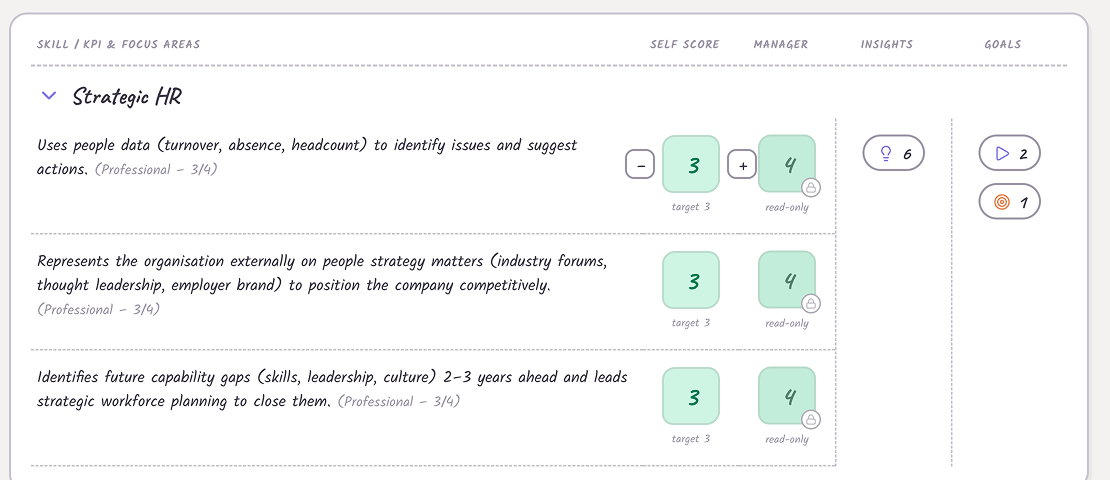
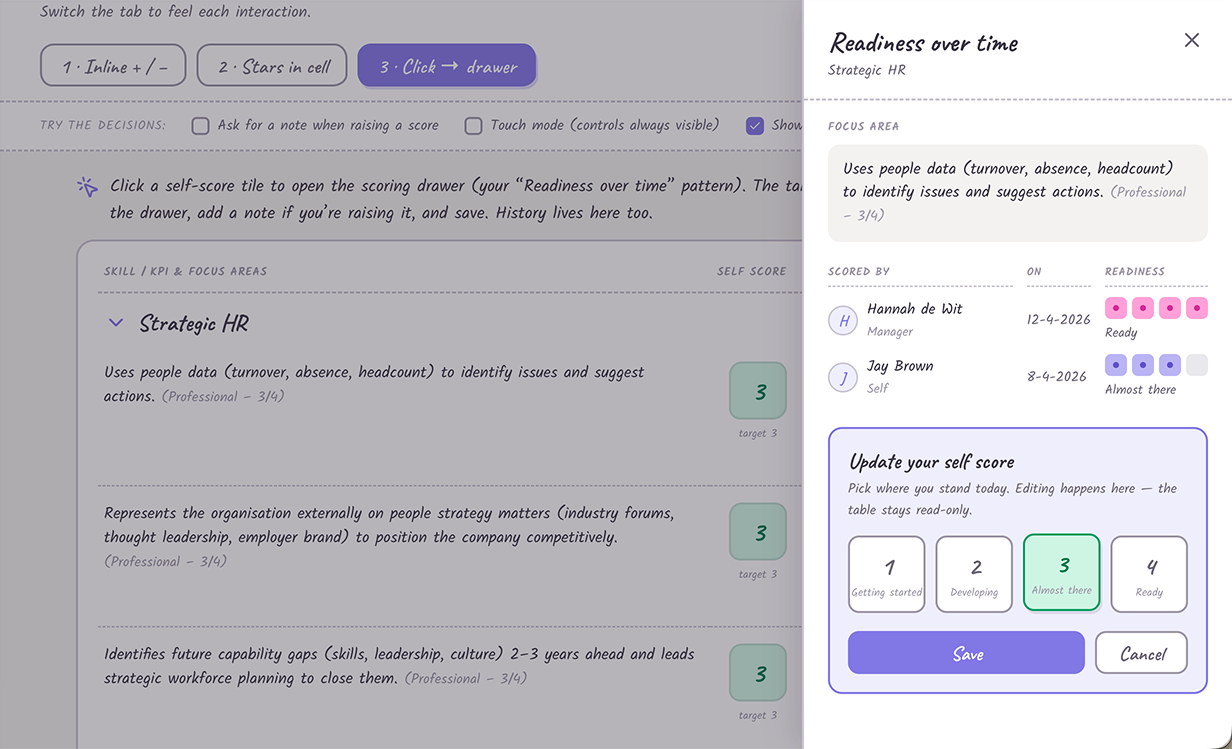
I worked out the table in detail and tested it with users. They saw the value of discussing progress this way, because all the data is connected. But they found it overwhelming, so I adjusted the UI and interaction. Columns collapse to show just one highlight number, and detailed drawers hold all the information and actions.
Managers also want to coach employees between evaluations, and update a score when someone has clearly improved. I explored three ways to do that:
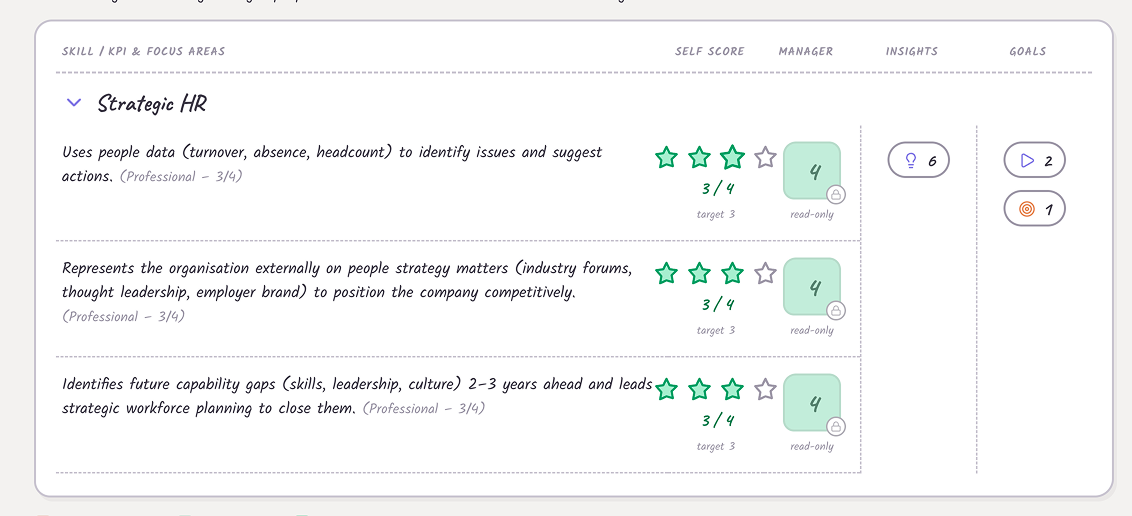
Plus and minus buttonsEdit in a drawerClick the stars
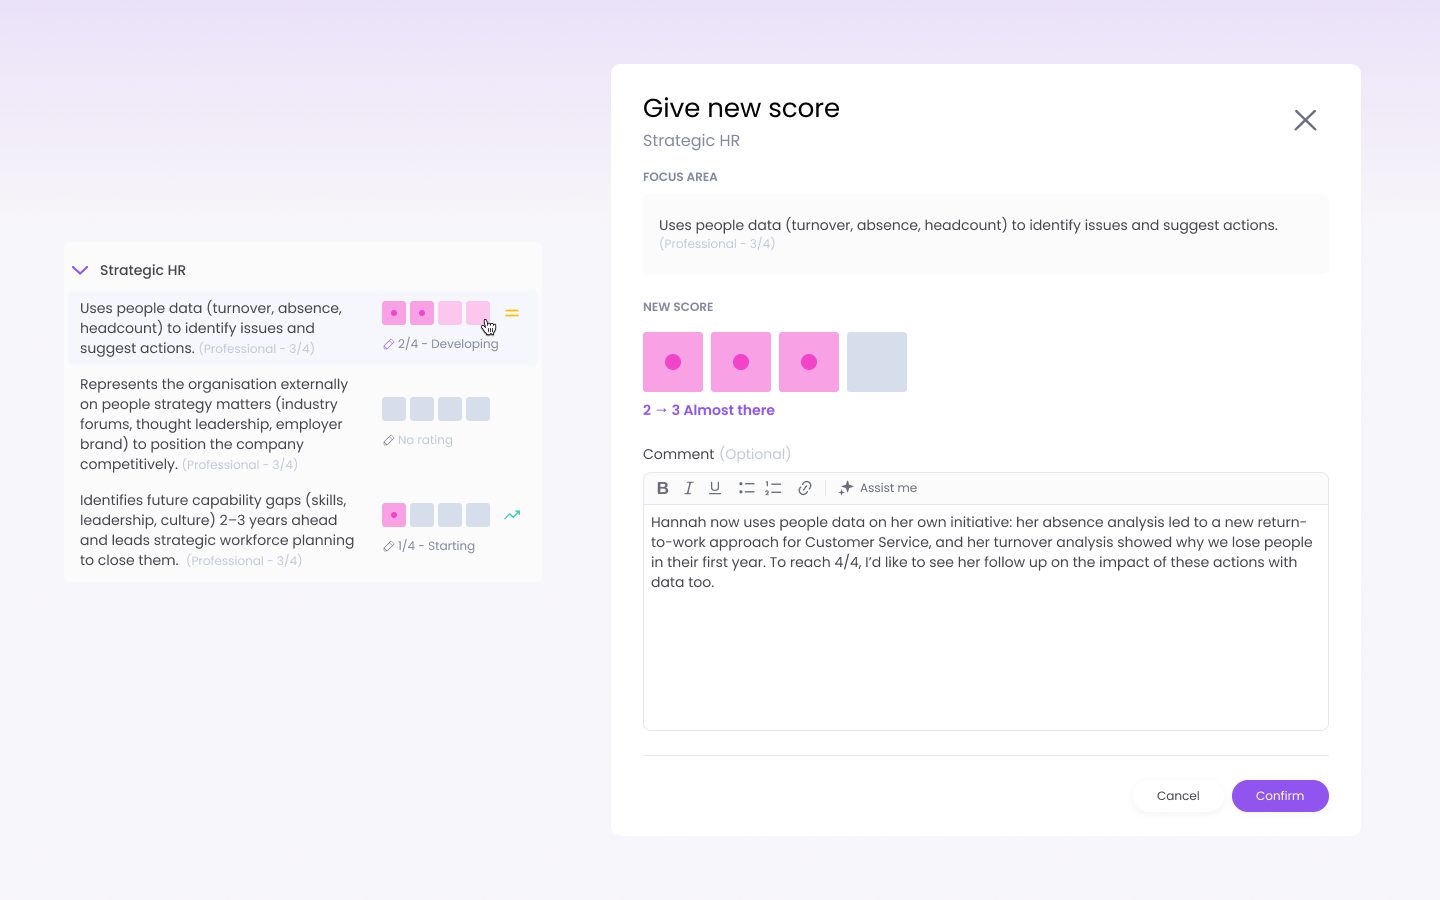
The chosen concept: stars you can fill in, just like in evaluations. Clicking them opens a modal to confirm the new score and add a comment. This takes away users' fear of changing a score by accident. The comment explains why it changed, so changes can be reported on and justified.
The chosen concept: score + confirmation
5. The spider graph finds its place
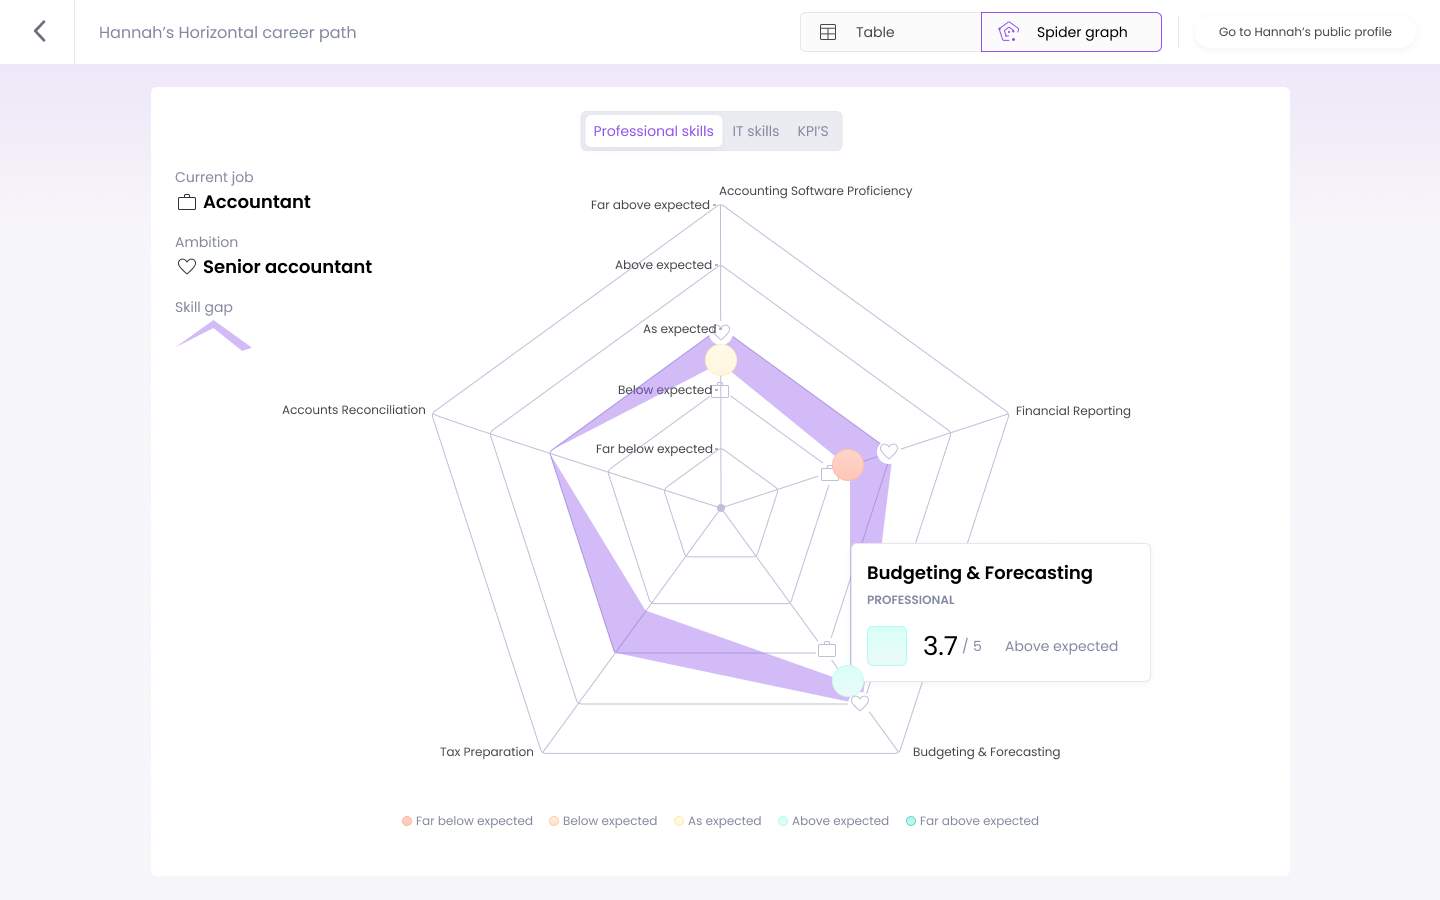
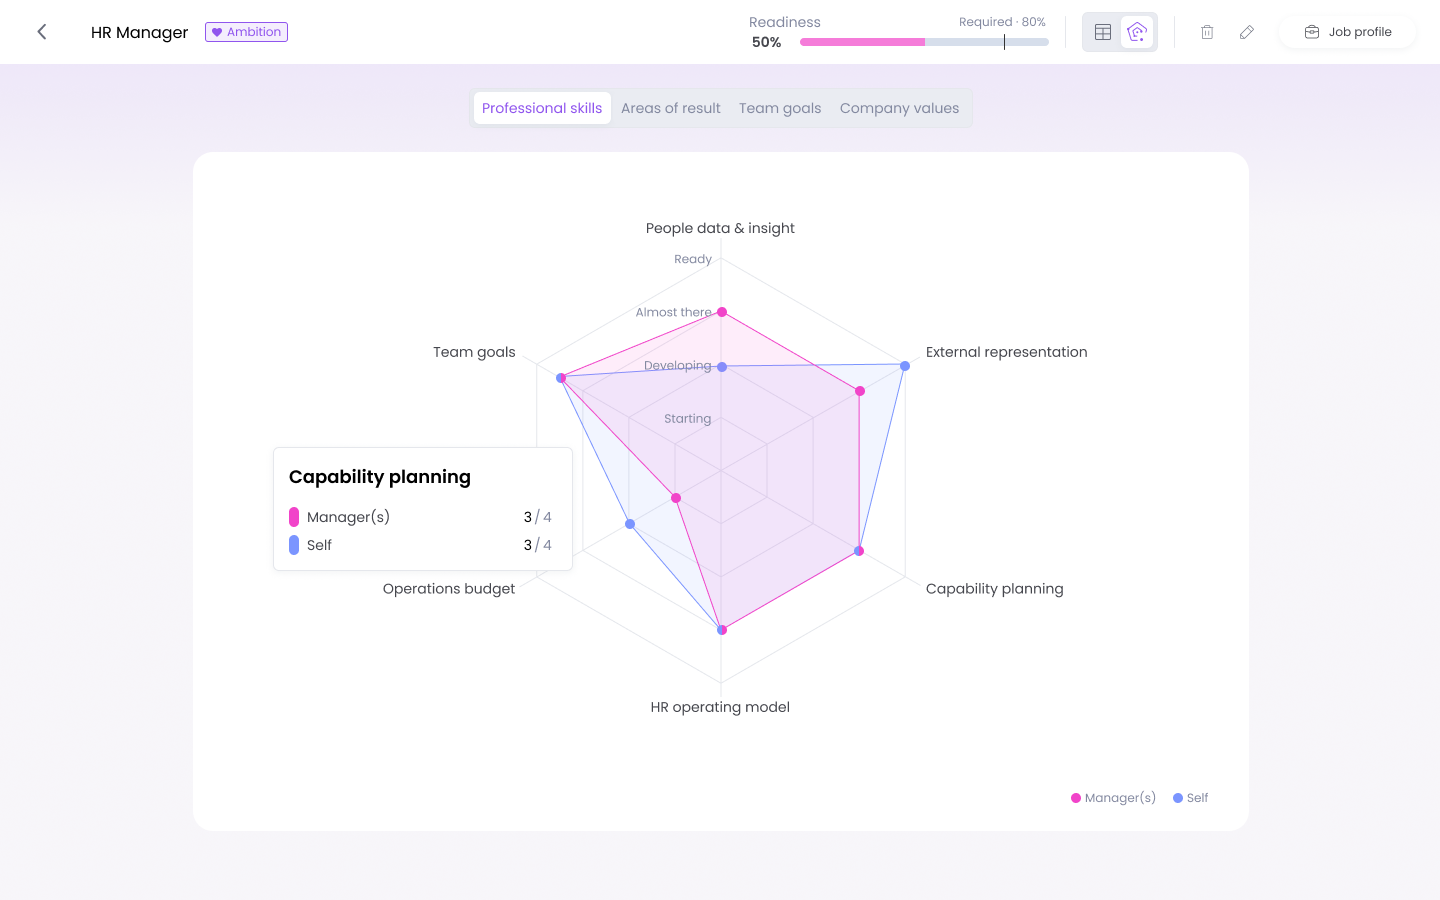
Users, CS and Sales had asked for a spider graph of performance on skills ever since I joined Learned. At first we saw it as part of the table. I chose to make it a second view instead: you pick table or spider graph. That made the page much clearer. Finally adding it, in a way that really helps users, gave me a lot of satisfaction.
Showing the spidergraph option inside the table was too complex and unclearVisualising the skill gap made a too complex designComparing manager and self scores was enough and made it easy to understand
The result
What went live: a career plans page, an ambition plan with a readiness score, an all plans overview for managers, a new menu, homepage widgets and an updated teams page.
Customers told our CS colleagues they find the new career page very insightful, and that it invites more personal, goal-focused conversations.
Reflections
What I enjoyed most was the scale: merging two modules touched a big part of the platform.
The biggest lesson: let go of the first idea, even when it sounds logical. The form fitted HR theory; the table fitted the problem. Merging goals into career was logical but big, and the real work was convincing stakeholders used to the old way.
I also learned not to take user input too literally. Our expertise lets us think outside the box and advise from there.
Next, we want to use the profile in evaluations, including evaluating against an ambition. And next time, I'd test with managers and employees too, not only HR admins: they use the plan in their one-on-ones.